原文 https://blog.csdn.net/yangwen123/article/details/38397359
简介
Android系统自带一个实用的程序异常退出的诊断daemon debuggerd。此进程可以侦测到程序崩溃,并将崩溃时的进程状态信息输出到文件和串口中,以供开发人员分析调试使用。Debuggerd的数据被保存在/data/tombstone/目录下,共可保存10个文件,当超过10个时,会覆盖重写最早生产的文件。串口中,则直接用DEBUG的tag,输出logcat信息。 Linux kernel有自己的一套signal机制,在应用程序崩溃时,通常系统内核都会发送signal到出问题的进程,以通知进程出现什么异常,这些进程可以捕获这些signal并对其做相应的处理。通常对于程序异常信号的处理,就是退出。Android在此机制上实现了一个更实用的功能:拦截这些信号,dump进程信息以供调试。
debuggerd的运行原理
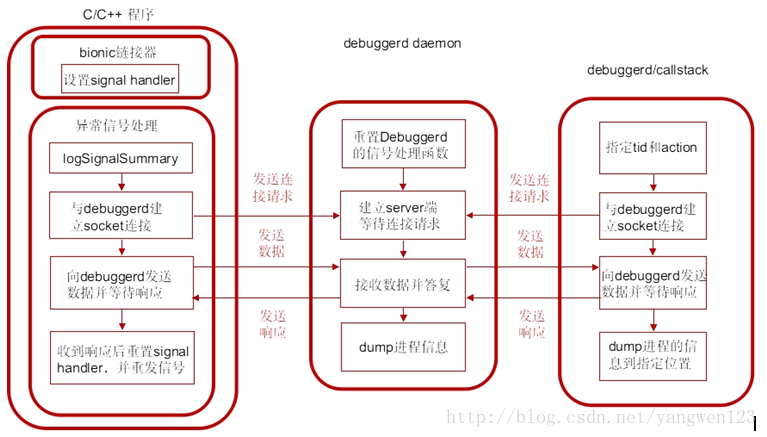
debuggerd创建一个名为 “Android:debuggerd”的socket,作为server端等待其他client端进程的连接,接收client端进程发送来的tid和action信息将由tid指定的那个进程的运行信息,按照由action指定的动作dump到文件或者控制台中可以作为debuggerd的client端的进程主要有几种:
1. 异常的C/C++程序
这种程序由bionic的linker安装异常信号的处理函数,当程序产生异常信号时,进入信号处理函数,与debuggerd建立。
2. debuggerd程序
debuggerd可以在控制台中以命令debuggerd -b []启动 ,然后与debuggerd daemon建立连接。这样debuggerd可以在不中断进程执行的情况下dump由tid指定的进程的信息。
3. dumpstate
控制台中运行命令dumpstate,并指定必要的参数,命令中会调用dump_backtrace_to_file与debuggerd交互。
debuggerd的使用方法
产生异常信号的C/C++程序与debuggerd建立连接后,debuggerd将进程信息dump到tombstone_XX文件中保存到/data/tombstone/文件夹下。可通过查看tombstone_XX分析异常进程的堆栈信息。
在控制台中以命令debuggerd -b []启动。如果加上-b参数,则由tid指定的进程的信息将dump到控制台上,否则dump到tombstone文件中。控制台中运行命令callstack/dumpstate,进程信息会写入这两个命令指定的文件中。
应用程序异常处理过程
应用程序入口属于bionic实现的一部分,则对所有android的程序有效。在应用程序入口地址__start后,__linker_init中调用debugger_init()函数来注册异常信号处理handler,以实现拦截系统异常的几个singal:SIGILL,SIGABRT, SIGBUS, SIGFPE,SIGSEGV和SIGPIPE:
linker/arch/arm/begin.S
- start:
- mov r0, sp
- mov r1, #0
- bl __linker_init
bionic\linker\ Linker.cpp
- extern "C" Elf32_Addr __linker_init(void* raw_args) {
- …
- Elf32_Addr start_address = __linker_init_post_relocation(args, linker_addr);
- set_soinfo_pool_protection(PROT_READ);
-
- return start_address;
- }
- static Elf32_Addr __linker_init_post_relocation(KernelArgumentBlock& args, Elf32_Addr linker_base) {
- ...
- debuggerd_init();
- ...
- }
bionic\linker\Debugger.c
- void debugger_init()
- {
- struct sigaction act;
- memset(&act, 0, sizeof(act));
- act.sa_sigaction = debugger_signal_handler;
- act.sa_flags = SA_RESTART | SA_SIGINFO;
- sigemptyset(&act.sa_mask);
- sigaction(SIGILL, &act, NULL);
- sigaction(SIGABRT, &act, NULL);
- sigaction(SIGBUS, &act, NULL);
- sigaction(SIGFPE, &act, NULL);
- sigaction(SIGSEGV, &act, NULL);
- sigaction(SIGSTKFLT, &act, NULL);
- sigaction(SIGPIPE, &act, NULL);
- }
bionic库中的链接器会对以下七种信号设置Handler(debugger_signal_handler):
- SIGILL(非法指令异常)
- SIGABRT(abort退出异常)
- SIGBUS(硬件访问异常)
- SIGFPE(浮点运算异常)
- SIGSEGV(内存访问异常)
- SIGSTKFLT(协处理器栈异常)
- SIGPIPE(管道异常)
debugger_init中act.sa_flags = SA_RESTART | SA_SIGINFO的涵义:
1) SA_RESTART
如果指定该参数,表示若信号中断了进程的某个系统调用,则系统自动启动该系统调用。如果不指定该参数,则被中断的系统调用返回失败,错误码为EINTR。这个标志位只要用于处理慢系统调用(可能会被阻塞的系统调用)。比如调用write系统调用写某个设备被阻塞,这时进程捕获某个信号且进入相应信号处理函数返回时,该系统调用可能要返回ENINTR错误。指定这个参数后,系统调用会重启,与RETRY_ON_EINTR宏配合使用则可以保证写操作的完成
2) SA_SIGINFO
如果指定该参数,表示信号附带的参数(siginfo_t结构体)可以被传递到信号处理函数中。
链接到bionic库上的C/C++程序崩溃时,内核会发送相应的signal,进程收到异常信号后,会转入debugger_signal_handler函数中进行处理。
- void debugger_signal_handler(int n, siginfo_t* info, void* unused)
- {
- char msgbuf[128];
- unsigned tid;
- int s;
-
- logSignalSummary(n, info);
-
- tid = gettid();
-
- s = socket_abstract_client(DEBUGGER_SOCKET_NAME, SOCK_STREAM);
-
- if (s >= 0) {
-
-
-
-
-
- int ret;
- debugger_msg_t msg;
- msg.action = DEBUGGER_ACTION_CRASH;
- msg.tid = tid;
- RETRY_ON_EINTR(ret, write(s, &msg, sizeof(msg)));
- if (ret == sizeof(msg)) {
-
-
- RETRY_ON_EINTR(ret, read(s, &tid, 1));
- int savedErrno = errno;
- notify_gdb_of_libraries();
- errno = savedErrno;
- }
-
- if (ret < 0) {
-
- format_buffer(msgbuf, sizeof(msgbuf),
- "Failed while talking to debuggerd: %s", strerror(errno));
- __libc_android_log_write(ANDROID_LOG_FATAL, "libc", msgbuf);
- }
-
- close(s);
- } else {
-
- format_buffer(msgbuf, sizeof(msgbuf),
- "Unable to open connection to debuggerd: %s", strerror(errno));
- __libc_android_log_write(ANDROID_LOG_FATAL, "libc", msgbuf);
- }
-
-
- signal(n, SIG_DFL);
-
-
-
-
-
-
-
-
- switch (n) {
- case SIGABRT:
- case SIGFPE:
- case SIGPIPE:
- case SIGSTKFLT:
- (void) tgkill(getpid(), gettid(), n);
- break;
- default:
- break;
- }
- }
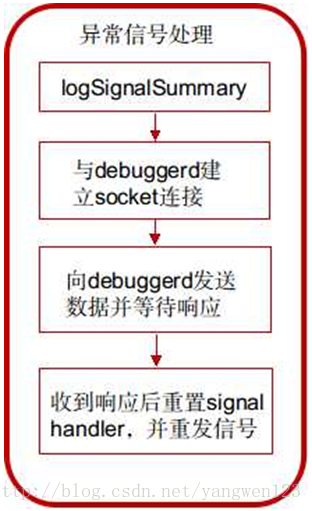
debugger_signal_handler函数处理流程:
1) 调用logSignalSummary将signal信息写入文件;
- static void logSignalSummary(int signum, const siginfo_t* info)
- {
- char buffer[128];
- char threadname[MAX_TASK_NAME_LEN + 1];
- char* signame;
- switch (signum) {
- case SIGILL: signame = "SIGILL"; break;
- case SIGABRT: signame = "SIGABRT"; break;
- case SIGBUS: signame = "SIGBUS"; break;
- case SIGFPE: signame = "SIGFPE"; break;
- case SIGSEGV: signame = "SIGSEGV"; break;
- case SIGSTKFLT: signame = "SIGSTKFLT"; break;
- case SIGPIPE: signame = "SIGPIPE"; break;
- default: signame = "???"; break;
- }
-
- if (prctl(PR_GET_NAME, (unsigned long)threadname, 0, 0, 0) != 0) {
- strcpy(threadname, "");
- } else {
-
-
- threadname[MAX_TASK_NAME_LEN] = 0;
- }
- format_buffer(buffer, sizeof(buffer),
- "Fatal signal %d (%s) at 0x%08x (code=%d), thread %d (%s)",
- signum, signame, info->si_addr, info->si_code, gettid(), threadname);
-
- __libc_android_log_write(ANDROID_LOG_FATAL, "libc", buffer);
- }
获取异常信号的名字和thread名字,并格式化字符串,调用函数__libc_android_log_write函数写入”/dev/log/main”中。
2) 调用socket_abstract_client函数与debuggerd建立socket连接;
- s = socket_abstract_client(DEBUGGER_SOCKET_NAME, SOCK_STREAM);
3) 如果连接建立成功,则设置结构体debugger_msg_t,并发送给debuggerd;
- msg.action = DEBUGGER_ACTION_CRASH;
- msg.tid = tid;
- RETRY_ON_EINTR(ret, write(s, &msg, sizeof(msg)));
4) 等待debuggerd的回复,阻塞在下面的调用中,收到回复后接着执行下面的流程;
- RETRY_ON_EINTR(ret, read(s, &tid, 1));
5) 重新设置信号处理函数为SIG_DFL,即采取默认的动作;
6) 重新发送信号,进程从当前信号处理函数返回后,会处理这个信号,进行默认的信号处理动作,即中断进程。
debuggerd的源码分析
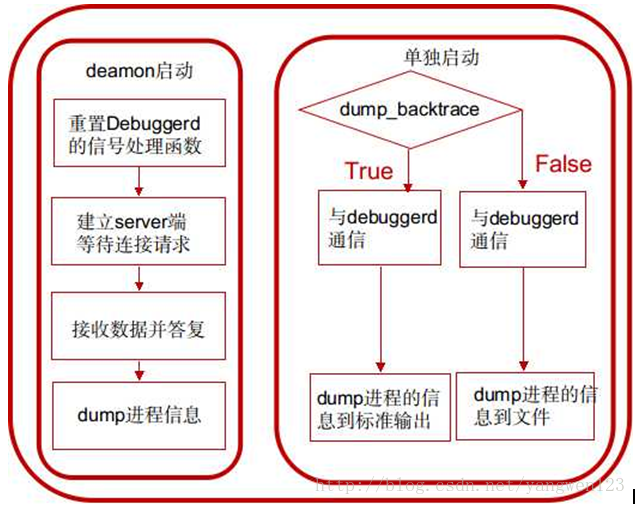
1. 在init进程中以deamon的方式启动,在init.rc中
- service debuggerd /system/bin/debuggerd
- class main
以这种方式启动的话,进入main函数后,将调用do_server函数,作为server端为其他进程提供dump进程信息的服务。
2. 直接运行system/bin/debuggerd可执行文件,需要指定参数,用法为:
以这种方式启动的话,进入main函数后,将调用do_explicit_dump函数与debuggerd daemon通信,将指定进程的信息dump到文件或控制台。
服务启动方式
- int main(int argc, char** argv) {
- if (argc == 1) {
- return do_server();
- }
- }
当启动debuggerd进程传递的参数个数为1时,此时启动的debuggerd将作为一个后台服务进程,专门接收应用程序异常退出消息而产生tombstone。
- static int do_server() {
- int s;
- struct sigaction act;
- int logsocket = -1;
-
-
-
-
-
- signal(SIGILL, SIG_DFL);
- signal(SIGABRT, SIG_DFL);
- signal(SIGBUS, SIG_DFL);
- signal(SIGFPE, SIG_DFL);
- signal(SIGSEGV, SIG_DFL);
- signal(SIGPIPE, SIG_IGN);
- signal(SIGSTKFLT, SIG_DFL);
-
- logsocket = socket_local_client("logd",
- ANDROID_SOCKET_NAMESPACE_ABSTRACT, SOCK_DGRAM);
- if(logsocket < 0) {
- logsocket = -1;
- } else {
- fcntl(logsocket, F_SETFD, FD_CLOEXEC);
- }
-
- act.sa_handler = SIG_DFL;
- sigemptyset(&act.sa_mask);
- sigaddset(&act.sa_mask,SIGCHLD);
- act.sa_flags = SA_NOCLDWAIT;
- sigaction(SIGCHLD, &act, 0);
-
- s = socket_local_server(DEBUGGER_SOCKET_NAME,
- ANDROID_SOCKET_NAMESPACE_ABSTRACT, SOCK_STREAM);
- if(s < 0) return 1;
- fcntl(s, F_SETFD, FD_CLOEXEC);
-
- LOG("debuggerd: " __DATE__ " " __TIME__ "\n");
-
-
- (void)check_corefile_limit();
-
- for(;;) {
- struct sockaddr addr;
- socklen_t alen;
- int fd;
- alen = sizeof(addr);
- XLOG("waiting for connection\n");
- fd = accept(s, &addr, &alen);
- if(fd < 0) {
- XLOG("accept failed: %s\n", strerror(errno));
- continue;
- }
-
- fcntl(fd, F_SETFD, FD_CLOEXEC);
-
- handle_request(fd);
- }
- return 0;
- }
1. 忽略debuggerd自身crash的处理;
2. 建立socket通信的server端;
3. 进入无限循环中,等待并接收客户端进程连接请求,并通过handle_request()函数处理请求;
handle_request
- static void handle_request(int fd) {
- XLOG("handle_request(%d)\n", fd);
-
- debugger_request_t request;
- int status = read_request(fd, &request);
- if (!status) {
- XLOG("BOOM: pid=%d uid=%d gid=%d tid=%d\n",
- request.pid, request.uid, request.gid, request.tid);
-
-
-
-
-
-
-
-
-
-
-
-
- if (ptrace(PTRACE_ATTACH, request.tid, 0, 0)) {
- LOG("ptrace attach failed: %s\n", strerror(errno));
- } else {
- bool detach_failed = false;
- bool attach_gdb = should_attach_gdb(&request);
- if (TEMP_FAILURE_RETRY(write(fd, "\0", 1)) != 1) {
- LOG("failed responding to client: %s\n", strerror(errno));
- } else {
- char* tombstone_path = NULL;
-
- if (request.action == DEBUGGER_ACTION_CRASH) {
- close(fd);
- fd = -1;
- }
-
- int total_sleep_time_usec = 0;
- for (;;) {
- int signal = wait_for_signal(request.tid, &total_sleep_time_usec);
- if (signal < 0) {
- break;
- }
-
- switch (signal) {
- case SIGSTOP:
- if (request.action == DEBUGGER_ACTION_DUMP_TOMBSTONE) {
- XLOG("stopped -- dumping to tombstone\n");
- tombstone_path = engrave_tombstone(request.pid, request.tid,
- signal, true, true, &detach_failed,
- &total_sleep_time_usec);
- } else if (request.action == DEBUGGER_ACTION_DUMP_BACKTRACE) {
- XLOG("stopped -- dumping to fd\n");
- dump_backtrace(fd, request.pid, request.tid, &detach_failed,
- &total_sleep_time_usec);
- } else {
- XLOG("stopped -- continuing\n");
- status = ptrace(PTRACE_CONT, request.tid, 0, 0);
- if (status) {
- LOG("ptrace continue failed: %s\n", strerror(errno));
- }
- continue;
- }
- break;
-
- case SIGILL:
- case SIGABRT:
- case SIGBUS:
- case SIGFPE:
- case SIGSEGV:
- case SIGSTKFLT: {
- XLOG("stopped -- fatal signal\n");
-
-
-
-
-
-
- kill(request.pid, SIGSTOP);
-
-
- tombstone_path = engrave_tombstone(request.pid, request.tid,
- signal, !attach_gdb, false, &detach_failed,
- &total_sleep_time_usec);
- break;
- }
-
- case SIGPIPE:
- LOG("socket-client process stopped due to SIGPIPE! \n");
- break;
-
- default:
- XLOG("stopped -- unexpected signal\n");
- LOG("process stopped due to unexpected signal %d\n", signal);
- break;
- }
- break;
- }
-
- if (request.action == DEBUGGER_ACTION_DUMP_TOMBSTONE) {
- if (tombstone_path) {
- write(fd, tombstone_path, strlen(tombstone_path));
- }
- close(fd);
- fd = -1;
- }
- free(tombstone_path);
- }
-
- XLOG("detaching\n");
- if (attach_gdb) {
-
- kill(request.pid, SIGSTOP);
-
-
- if (ptrace(PTRACE_DETACH, request.tid, 0, 0)) {
- LOG("ptrace detach from %d failed: %s\n", request.tid, strerror(errno));
- detach_failed = true;
- }
-
-
-
-
-
-
-
- wait_for_user_action(request.pid);
- } else {
-
- if (ptrace(PTRACE_DETACH, request.tid, 0, 0)) {
- LOG("ptrace detach from %d failed: %s\n", request.tid, strerror(errno));
- detach_failed = true;
- }
- }
-
-
- kill(request.pid, SIGCONT);
-
-
-
-
- if (detach_failed) {
- LOG("debuggerd committing suicide to free the zombie!\n");
- kill(getpid(), SIGKILL);
- }
- }
-
- }
- if (fd >= 0) {
- close(fd);
- }
- }
1) 调用read_request函数读取client端进程发送来的数据:
- static int read_request(int fd, debugger_request_t* out_request) {
- struct ucred cr;
- int len = sizeof(cr);
- int status = getsockopt(fd, SOL_SOCKET, SO_PEERCRED, &cr, &len);
- if (status != 0) {
- LOG("cannot get credentials\n");
- return -1;
- }
-
- XLOG("reading tid\n");
- fcntl(fd, F_SETFL, O_NONBLOCK);
-
- struct pollfd pollfds[1];
- pollfds[0].fd = fd;
- pollfds[0].events = POLLIN;
- pollfds[0].revents = 0;
- status = TEMP_FAILURE_RETRY(poll(pollfds, 1, 3000));
- if (status != 1) {
- LOG("timed out reading tid\n");
- return -1;
- }
-
- debugger_msg_t msg;
- status = TEMP_FAILURE_RETRY(read(fd, &msg, sizeof(msg)));
- if (status < 0) {
- LOG("read failure? %s\n", strerror(errno));
- return -1;
- }
- if (status != sizeof(msg)) {
- LOG("invalid crash request of size %d\n", status);
- return -1;
- }
-
- out_request->action = msg.action;
- out_request->tid = msg.tid;
- out_request->pid = cr.pid;
- out_request->uid = cr.uid;
- out_request->gid = cr.gid;
-
- if (msg.action == DEBUGGER_ACTION_CRASH) {
-
- char buf[64];
- struct stat s;
- snprintf(buf, sizeof buf, "/proc/%d/task/%d", out_request->pid, out_request->tid);
- if(stat(buf, &s)) {
- LOG("tid %d does not exist in pid %d. ignoring debug request\n",
- out_request->tid, out_request->pid);
- return -1;
- }
- } else if (cr.uid == 0
- || (cr.uid == AID_SYSTEM && msg.action == DEBUGGER_ACTION_DUMP_BACKTRACE)) {
-
-
- status = get_process_info(out_request->tid, &out_request->pid,
- &out_request->uid, &out_request->gid);
- if (status < 0) {
- LOG("tid %d does not exist. ignoring explicit dump request\n",
- out_request->tid);
- return -1;
- }
- } else {
-
- return -1;
- }
- return 0;
- }
☞ 从socket中读取client端进程的pid uid gid
- getsockopt(fd, SOL_SOCKET, SO_PEERCRED, &cr, &len);
☞ 轮询socket句柄
- struct pollfd pollfds[1];
- pollfds[0].fd = fd;
- pollfds[0].events = POLLIN;
- pollfds[0].revents = 0;
- status = TEMP_FAILURE_RETRY(poll(pollfds, 1, 3000));
☞ 从socket上读取debugger_msg_t结构体
- debugger_msg_t msg;
- status = TEMP_FAILURE_RETRY(read(fd, &msg, sizeof(msg)));
- if (status < 0) {
- LOG("read failure? %s\n", strerror(errno));
- return -1;
- }
- if (status != sizeof(msg)) {
- LOG("invalid crash request of size %d\n", status);
- return -1;
- }
- out_request->action = msg.action;
- out_request->tid = msg.tid;
- out_request->pid = cr.pid;
- out_request->uid = cr.uid;
- out_request->gid = cr.gid;
☞ 如果debugger_msg_t中设置的action为DEBUGGER_ACTION_CRASH,说明是crash的C/C++进程发来的请求,则判断传进来的tid是否有效。
- if (msg.action == DEBUGGER_ACTION_CRASH) {
-
- char buf[64];
- struct stat s;
- snprintf(buf, sizeof buf, "/proc/%d/task/%d", out_request->pid, out_request->tid);
- if(stat(buf, &s)) {
- LOG("tid %d does not exist in pid %d. ignoring debug request\n",
- out_request->tid, out_request->pid);
- return -1;
- }
- }
☞ 如果debugger_msg_t中设置的action为DEBUGGER_ACTION_DUMP_BACKTRACE说明是其他方式(debuggerd)发来的请求,则要求必须为root权限或者system权限,然后再判断tid是否有效。
2) 从read_request返回后,调用ptrace函数attach到tid指定的进程,此时debuggerd将变为被attache进程的父进程,然后ptrace函数会向子进程发送SIGSTOP信号将子进程停下来。此时,父进程有机会检查子进程核心image和寄存器的值。
- ptrace(PTRACE_ATTACH, request.tid, 0, 0)
3) 调用下面的语句给client端子进程回复消息,使clinet端的进程能从read调用中返回。
- TEMP_FAILURE_RETRY(write(fd, "\0", 1)
4) 在for循环中等待子进程停止。
- int signal = wait_for_signal(request.tid, &total_sleep_time_usec);
5) 子进程根据收到的不同信号、不同的action进行不同的处理
- switch (signal) {
- case SIGSTOP:
- if (request.action == DEBUGGER_ACTION_DUMP_TOMBSTONE) {
- XLOG("stopped -- dumping to tombstone\n");
- tombstone_path = engrave_tombstone(request.pid, request.tid,
- signal, true, true, &detach_failed,
- &total_sleep_time_usec);
- } else if (request.action == DEBUGGER_ACTION_DUMP_BACKTRACE) {
- XLOG("stopped -- dumping to fd\n");
- dump_backtrace(fd, request.pid, request.tid, &detach_failed,
- &total_sleep_time_usec);
- } else {
- XLOG("stopped -- continuing\n");
- status = ptrace(PTRACE_CONT, request.tid, 0, 0);
- if (status) {
- LOG("ptrace continue failed: %s\n", strerror(errno));
- }
- continue;
- }
- break;
- case SIGILL:
- case SIGABRT:
- case SIGBUS:
- case SIGFPE:
- case SIGSEGV:
- case SIGSTKFLT: {
- XLOG("stopped -- fatal signal\n");
- kill(request.pid, SIGSTOP);
- tombstone_path = engrave_tombstone(request.pid, request.tid,
- signal, !attach_gdb, false, &detach_failed,
- &total_sleep_time_usec);
- break;
- }
- case SIGPIPE:
- LOG("socket-client process stopped due to SIGPIPE! \n");
- break;
- default:
- XLOG("stopped -- unexpected signal\n");
- LOG("process stopped due to unexpected signal %d\n", signal);
- break;
- }
☞子进程收到SIGSTOP说明进程并没有发生crash,根据action不同将进程信息写入tombstone文件。
☞子进程收到七种异常信号说明是进程发生crash,调用engrave_tombstone直接将dump的信息写到tombstone。
6) 调用ptrace(PTRACE_DETACH, request.tid, 0, 0)解除对子进程的追踪;
- if (attach_gdb) {
- kill(request.pid, SIGSTOP);
- if (ptrace(PTRACE_DETACH, request.tid, 0, 0)) {
- LOG("ptrace detach from %d failed: %s\n", request.tid, strerror(errno));
- detach_failed = true;
- }
- wait_for_user_action(request.pid);
- } else {
- if (ptrace(PTRACE_DETACH, request.tid, 0, 0)) {
- LOG("ptrace detach from %d failed: %s\n", request.tid, strerror(errno));
- detach_failed = true;
- }
- }
如果运行了类似以下指令:adb shell setprop debug.db.uid 10000;则所有uid<10000 0="" attach_gdb="" crash="" gdb="" p="" ptrace="" request.tid="" true="">
adb forward tcp:5039 tcp:5039
adb shell gdbserver :5039 --attach pid &
用户按下HOME或者VOLUME DOWN按键,可以使进程继续进行,自然crash
attach_gdb为false时,只会解除对子进程的追踪。
7) 调用kill(request.pid, SIGCONT)恢复被停止的子进程,并让其自然终止;
engrave_tombstone
- char* engrave_tombstone(pid_t pid, pid_t tid, int signal,
- bool dump_sibling_threads, bool quiet, bool* detach_failed,
- int* total_sleep_time_usec) {
- mkdir(TOMBSTONE_DIR, 0755);
- chown(TOMBSTONE_DIR, AID_SYSTEM, AID_SYSTEM);
-
-
- dump_creash_maps(pid);
-
- int fd;
- char* path = find_and_open_tombstone(&fd);
- if (!path) {
- *detach_failed = false;
- return NULL;
- }
-
- log_t log;
- log.tfd = fd;
- log.quiet = quiet;
- *detach_failed = dump_crash(&log, pid, tid, signal, dump_sibling_threads,
- total_sleep_time_usec);
-
- close(fd);
- return path;
- }
对于crash的C/C++进程,主要通过这个函数dump进程信息
1.创建”/data/tombstones”文件夹并修改权限
2.调用函数find_and_open_tombstone,tombstone_XX文件最多10个,超过则覆盖最早的
3.调用dump_crash将所有信息dump到tombstone文件:
☞ dump_build_info(log);
☞ dump_thread_info(log, pid, tid, true);
☞ dump_fault_addr(log, tid, signal);
☞ dump_thread(context, log, tid, true, total_sleep_time_usec) dump进程的上下文信息
☞ dump_logs(log, pid, true);
☞ dump_sibling_thread_report(context, log, pid, tid, total_sleep_time_usec);
dump_backtrace
- void dump_backtrace(int fd, pid_t pid, pid_t tid, bool* detach_failed,
- int* total_sleep_time_usec) {
- log_t log;
- log.tfd = fd;
- log.quiet = true;
-
- ptrace_context_t* context = load_ptrace_context(tid);
- dump_process_header(&log, pid);
- dump_thread(&log, tid, context, true, detach_failed, total_sleep_time_usec);
-
- char task_path[64];
- snprintf(task_path, sizeof(task_path), "/proc/%d/task", pid);
- DIR* d = opendir(task_path);
- if (d) {
- struct dirent debuf;
- struct dirent *de;
- while (!readdir_r(d, &debuf, &de) && de) {
- if (!strcmp(de->d_name, ".") || !strcmp(de->d_name, "..")) {
- continue;
- }
-
- char* end;
- pid_t new_tid = strtoul(de->d_name, &end, 10);
- if (*end || new_tid == tid) {
- continue;
- }
-
- dump_thread(&log, new_tid, context, false, detach_failed, total_sleep_time_usec);
- }
- closedir(d);
- }
-
- dump_process_footer(&log, pid);
- free_ptrace_context(context);
- }
☞ dump_process_header(&log, pid);
☞ dump_thread(&log, tid, context, true, detach_failed, total_sleep_time_usec);
☞ dump_process_footer(&log, pid);
调试工具方式
- int main(int argc, char** argv) {
- bool dump_backtrace = false;
- bool have_tid = false;
- pid_t tid = 0;
- for (int i = 1; i < argc; i++) {
- if (!strcmp(argv[i], "-b")) {
- dump_backtrace = true;
- } else if (!have_tid) {
- tid = atoi(argv[i]);
- have_tid = true;
- } else {
- usage();
- return 1;
- }
- }
- if (!have_tid) {
- usage();
- return 1;
- }
- return do_explicit_dump(tid, dump_backtrace);
- }
通过do_explicit_dump函数dump出指定进程的栈信息等
- static int do_explicit_dump(pid_t tid, bool dump_backtrace) {
- fprintf(stdout, "Sending request to dump task %d.\n", tid);
-
- if (dump_backtrace) {
- fflush(stdout);
- if (dump_backtrace_to_file(tid, fileno(stdout)) < 0) {
- fputs("Error dumping backtrace.\n", stderr);
- return 1;
- }
- } else {
- char tombstone_path[PATH_MAX];
- if (dump_tombstone(tid, tombstone_path, sizeof(tombstone_path)) < 0) {
- fputs("Error dumping tombstone.\n", stderr);
- return 1;
- }
- fprintf(stderr, "Tombstone written to: %s\n", tombstone_path);
- }
- return 0;
- }
☞ dump_backtrace_to_file(tid, fileno(stdout))
☞ dump_tombstone(tid, tombstone_path, sizeof(tombstone_path))
沒有留言:
張貼留言